SAT Circles Made Easy: 7 Ways to Solve Geometry Problems Using Desmos (With Examples)
Test Preparation
Jul 24, 2025
Learn seven effective methods to solve SAT circle problems using Desmos, enhancing your geometry skills and test performance with visual tools.
Struggling with SAT circle problems? Desmos can help you solve them faster and with less confusion. Here's how:
Graph equations instantly: Visualize circles by entering their equations directly into Desmos.
Find intersections: Spot where circles and lines meet with automatic intersection points.
Tackle transformations: Adjust circle properties like size and position in real time using sliders.
Work with tangents and chords: Confirm tangent lines or measure chord lengths directly on the graph.
Verify calculations: Use visuals to double-check radius, area, and circumference.
Desmos is available on the digital SAT, making it a powerful tool for geometry problems. Pair it with focused practice to improve accuracy and speed during the test. Dive into the full guide for step-by-step tips and examples.
Circles on the Desmos
How to Enter Circle Equations in Desmos
If you're tackling SAT geometry problems, knowing how to correctly input circle equations in Desmos can save you time and effort.
Entering the Standard Circle Equation
The standard form of a circle equation is (x - h)² + (y - k)² = r², where (h, k) is the center of the circle and r is the radius. In Desmos, you can simply type this equation into an expression line, replacing h, k, and r with the specific values for your circle.
For instance, to graph a circle centered at (2, 3) with a radius of 4, you would input (x - 2)^2 + (y - 3)^2 = 16. Here, the radius is squared (4² = 16), and the signs inside the parentheses are the opposites of the center's coordinates.
To make things more flexible, you can define the radius in a separate expression line. For example, type r = 4, then use (x - 2)^2 + (y - 3)^2 = r^2 in another line. This method allows you to easily test different radius values by adjusting the slider for r.
If your equation isn’t already in standard form, you’ll need to complete the square to rewrite it. For example, an equation like x² + y² - 6x - 4y + 9 = 0 can be transformed into the standard form (x - h)² + (y - k)² = r², which Desmos can graph directly.
Once your circle is graphed, it’s important to adjust the view to ensure the entire circle is visible.
Adjusting Graph View Settings
After entering your circle equation, it’s common to find that the graph doesn’t fully display the circle. This happens because the default viewing window might not accommodate the size or location of your circle.
To fix this, use the plus and minus buttons to zoom in or out until the circle is fully visible. If you lose track of your graph, click the house icon to reset the view. Alternatively, use the "Zoom Fit" option to automatically adjust the window to fit your graph.
For more precise control, click the wrench icon to access Graph Settings. Here, you can manually set the domain and range of your graph, which is especially useful for circles with centers far from the origin or very large radii.
To improve accuracy, activate "Minor Grid" for detailed coordinate readings, and toggle the visibility of axes by checking or unchecking their respective boxes. If your circle involves π (like in problems with arc lengths or angles in radians), you can set the axis step to "pi" for clearer labeling.
For presentations or a better view, switch between default and large display sizes using the radio buttons. If you want to avoid accidentally altering your graph, enable the "Lock Viewport" option, which disables zooming and panning.
Lastly, keep in mind that Desmos reserves lowercase x and y as variables. If you need custom functions, use uppercase X and Y instead.
7 Methods for Solving SAT Circle Problems with Desmos

Now that you've learned how to input circle equations and tweak your view settings, let’s dive into seven ways you can approach SAT circle problems using Desmos. These methods range from identifying basic properties to exploring dynamic transformations.
1. Finding Center and Radius from Equations
One of the first steps in tackling SAT circle problems is identifying the center and radius from a given equation. Desmos simplifies this by offering a visual representation.
For example, entering the equation
(x - 2)² + (y - 3)² = 16
into Desmos will graph a circle with its center at (2, 3) and a radius of 4 units (since (4^2 = 16)). If the equation isn’t in standard form, you’ll need to complete the square first. For instance, rewriting
x² + y² - 6x - 4y + 9 = 0
as
(x - 3)² + (y - 2)² = 4
reveals a center at (3, 2) and a radius of 2.
2. Creating Circle Graphs from Given Information
Sometimes, SAT problems provide the center and radius, leaving you to graph the circle. Desmos makes this process quick and straightforward.
For example, to graph a circle with a center at (-1, 4) and a radius of 5, enter
(x + 1)² + (y - 4)² = 25.
Even when dealing with fractional or decimal values, Desmos handles it effortlessly. A circle centered at (2.5, -3.75) with a radius of 1.5 can be graphed as
(x - 2.5)² + (y + 3.75)² = 2.25.
3. Locating Intersection Points
Intersection problems - whether between two circles or a circle and a line - are common on the SAT. Desmos highlights these intersections with small gray dots, making them easy to spot.
To find where two circles intersect, input both equations. For example, graphing
(x - 1)² + (y - 2)² = 9
and
(x - 4)² + (y - 2)² = 16
shows their intersection points as gray dots. Clicking on these dots reveals their exact coordinates. The same approach works for circle-line intersections, such as graphing
(x - 2)² + (y - 1)² = 25
alongside
y = x + 3.
4. Working with Tangent Lines
Tangent line problems focus on lines that touch a circle at exactly one point. Desmos helps you visualize these scenarios effectively.
To determine if a line is tangent, graph the circle and overlay the line. If the line intersects the circle at two points, it’s a secant, not a tangent. For problems involving tangent lines from external points, graph the circle and mark the external point. While Desmos won’t automatically draw the tangent, the visual setup aids your calculations.
You can also use Desmos to measure relevant segments, like distances or chord lengths, to further analyze the problem.
5. Measuring Distances and Chord Lengths
Visualizing distances and chords becomes much easier with Desmos. Whether you’re calculating the distance between two points on a circle or determining the length of a chord, the graph provides clarity.
For chord lengths, you can restrict a line’s domain to display only the chord segment. For instance, if a chord spans from x = 1 to x = 5, enter the equation
y = 2x + 1 {1 ≤ x ≤ 5}
to show just that portion of the line.
6. Checking Area and Circumference Calculations
While Desmos doesn’t directly calculate a circle’s area or circumference, it visually confirms the radius, which is key for these computations.
After graphing the circle, double-check the radius. Then, use formulas like (A = \pi r^2) for area and (C = 2\pi r) for circumference to ensure your calculations are accurate.
7. Understanding Circle Transformations
Circle transformations - shifting, resizing, or modifying equations - are easier to grasp with Desmos. These transformations often appear on the SAT, and Desmos provides an instant visual.
Start with a circle like
x² + y² = 9.
Changing it to
(x - 3)² + y² = 9
shifts the circle 3 units to the right, while
x² + (y + 2)² = 9
moves it 2 units down. To explore scaling, compare
x² + y² = 9
with
x² + y² = 36.
Here, the radius increases from 3 to 6, making the circle larger. Using sliders in Desmos allows you to dynamically adjust the radius and see how the circle changes in real time.
Comparing Different Desmos Methods
Each Desmos method is tailored to tackle specific SAT circle problems. Picking the right one can make solving these challenges faster and more effective.
Strengths and Weaknesses of Each Method
Finding Center and Radius
This approach is great for uncovering a circle's basic properties, like its center and radius, with minimal effort. However, it’s not ideal for addressing more complex relationships between geometric elements.
Creating Circle Graphs
Graphing a circle using provided coordinates is a simple way to visualize the problem. It handles fractional and decimal values with ease, making it a solid choice for setting up scenarios. That said, it may not directly address intricate interactions within the problem.
Locating Intersection Points
When you input multiple equations into Desmos, it automatically displays intersection points. This makes it a powerful tool for identifying where circles and lines meet. It’s particularly handy for multiple-choice questions where speed and accuracy are key.
Working with Tangent Lines
Desmos can visually confirm whether a line touches a circle or passes through it. While this method is excellent for verification, it doesn’t compute tangent equations for you. As a result, it’s more suited for confirming your work rather than performing calculations.
Measuring Distances and Chord Lengths
Desmos includes geometry tools that let you measure segment lengths or distances between points. This feature is straightforward and useful for verifying specific measurements.
Checking Area and Circumference Calculations
Although Desmos doesn’t directly calculate area or circumference, it’s a helpful tool for verification. You’ll still need to use formulas like A = πr² and C = 2πr, but the graph’s visual representation of the radius can help confirm your results.
Understanding Circle Transformations
Desmos’ transformation tools, such as sliders, make it easy to explore shifts, scaling, and other changes to a circle. These visual aids are particularly helpful for comparing multiple circles or understanding how parameter changes affect the graph. While this method provides valuable insights, it’s best used alongside other techniques for verification.
Combining Methods for Better Results
For multifaceted problems, blending several methods often yields the best results. For instance, when solving intersection problems involving circles and lines, you can graph the equations and then measure the necessary distances. Similarly, for transformation-related challenges, visual exploration can clarify concepts while other methods ensure accurate calculations.
The type of problem should guide your approach. Desmos shines in multiple-choice settings, where its speed and precision are essential. However, for problems involving equivalent expressions, traditional algebraic methods might sometimes be faster than entering complex equations into Desmos.
Time is a crucial factor. Methods like locating intersection points or measuring distances offer quick solutions, while exploring transformations might take longer but provide deeper understanding. Choosing the right combination of techniques can greatly boost your performance during the test.
Using Desmos with ChatSAT for Better SAT Prep

By combining Desmos' interactive graphing capabilities with ChatSAT's tailored learning tools, you can sharpen your skills in tackling SAT circle problems. Desmos helps you visualize circle equations, while ChatSAT ensures your practice is focused and productive. Together, they create a streamlined approach to mastering circle geometry.
Getting More Circle Practice with ChatSAT
ChatSAT pairs seamlessly with Desmos to enhance your understanding of circle geometry through targeted practice. Each session kicks off with concise AI-led lessons covering key circle concepts. These lessons include detailed, step-by-step instructions to help you make the most of Desmos.
When you face a tricky circle problem, you can begin by applying the Desmos techniques discussed earlier. If you hit a roadblock, ChatSAT's "Ask-Why" button is there to provide instant explanations, breaking down any confusing steps.
ChatSAT's Urgency Detector takes it a step further by monitoring your performance on circle problems. If certain areas, like finding intersection points, give you trouble, the system adjusts your study plan to include more practice in those areas. Meanwhile, you can continue using Desmos to visualize and better understand the solutions. This creates a powerful cycle where your graphing skills and conceptual knowledge grow together.
The platform also offers curated questions that complement Desmos' graphical approach, helping you quickly grasp circle problem strategies. These questions often highlight cases where graphing can offer clear advantages, building your intuition for when to rely on your calculator during the SAT.
ChatSAT Feature | How It Works with Desmos |
|---|---|
Visual Tools | Adds interactive elements to enhance Desmos' graphing capabilities |
Smart Review | Focuses on circle concepts where graphing is most effective |
Real-time Guidance | Provides instant feedback on your approach using Desmos |
Adaptive Testing | Customizes questions based on your current graphing proficiency |
In addition to practice, ChatSAT tracks your progress to pinpoint areas where you need more work.
Monitoring Your Circle Problem Progress
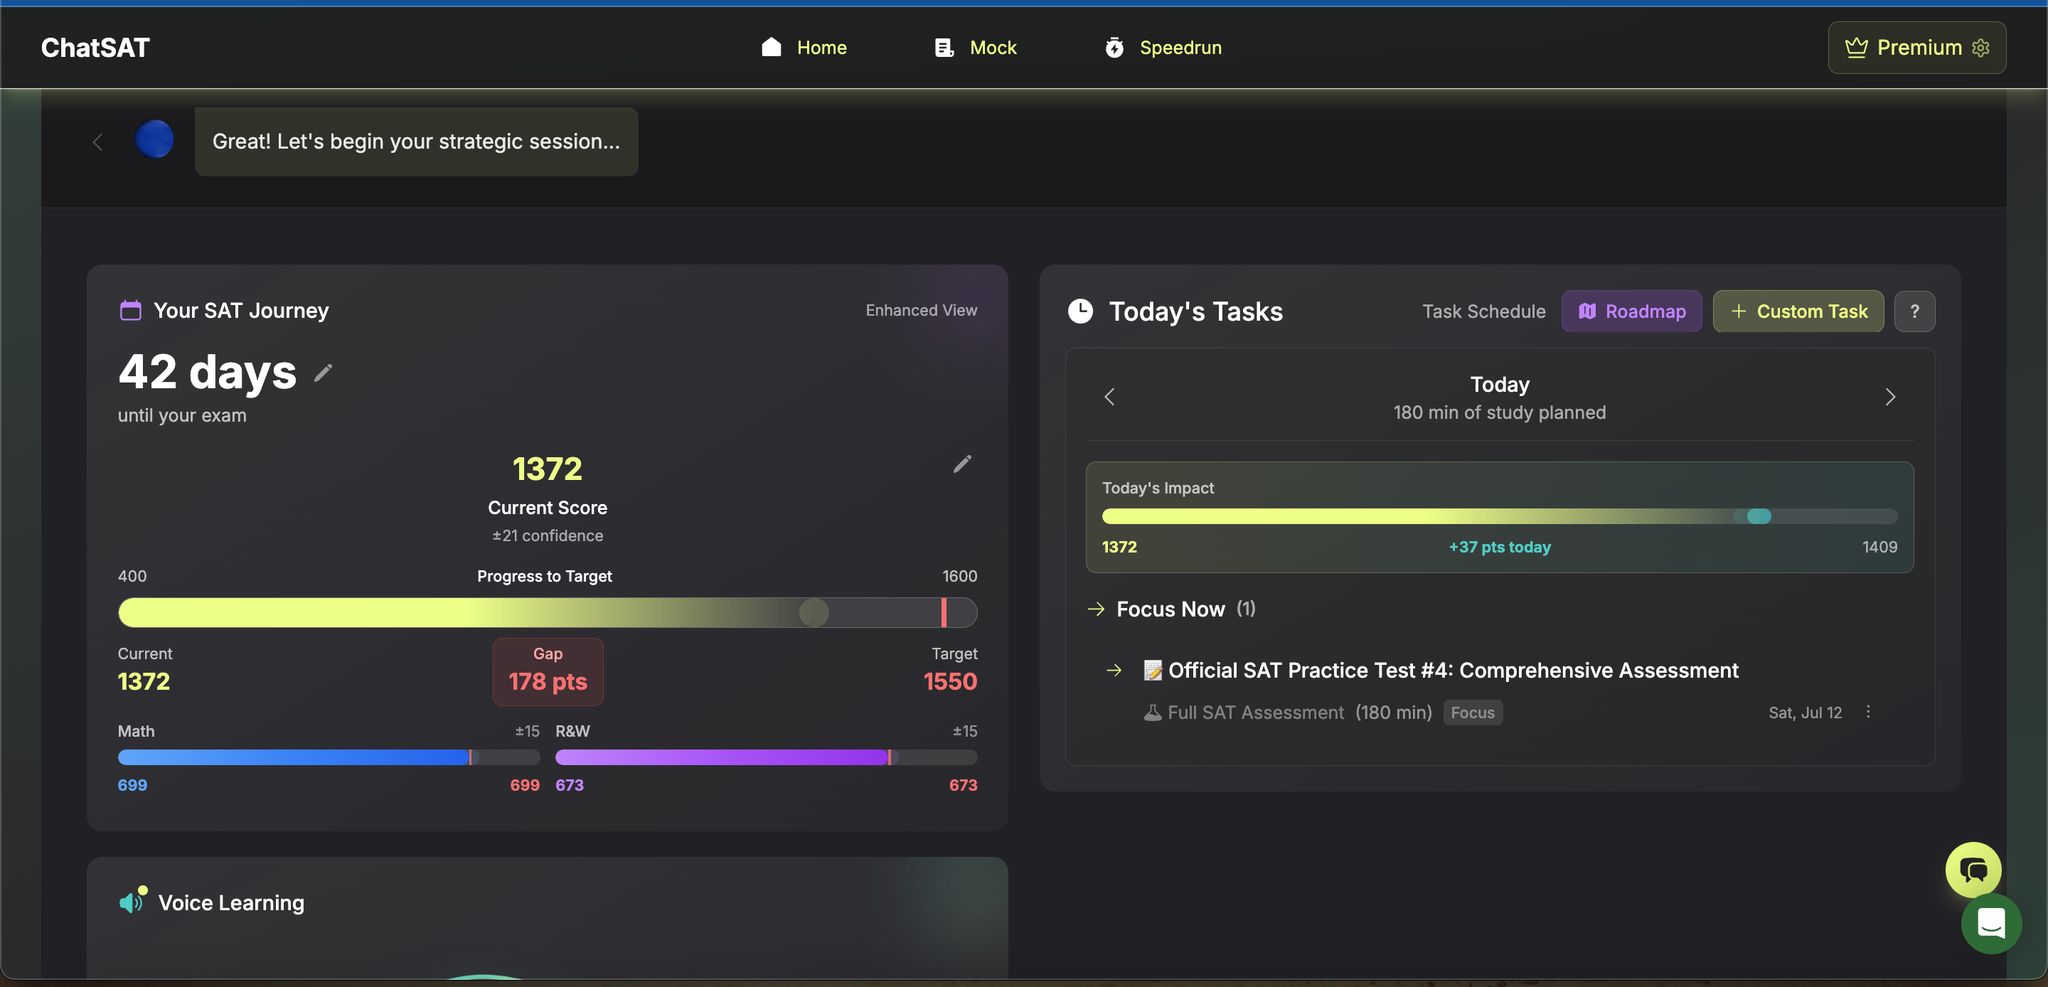
ChatSAT's tracking tools make it easy to see where your circle geometry skills need improvement and how much progress you're making. Every practice session feeds into the platform's analytics, helping you identify problem types that challenge you the most. For example, if tangent lines are a recurring issue, ChatSAT will recommend targeted practice in that area. You can then apply the Desmos tangent line techniques as you work through these focused problems.
The mixed-topic drills are especially useful for circle geometry. They mimic real test conditions, pushing you to quickly decide whether graphing with Desmos or sticking to algebraic methods will be more effective. These drills sharpen your decision-making skills, which is critical for solving problems efficiently under time constraints.
ChatSAT also helps you manage your time better by analyzing which circle problems you solve fastest with Desmos and which ones slow you down. This insight becomes invaluable as test day approaches, allowing you to make smarter choices about when to use your graphing calculator.
To keep you on track, ChatSAT's week-by-week calendar prioritizes the circle concepts that will have the biggest impact on your performance. Topics you’ve already mastered gradually phase out, ensuring your study time is spent where it’s needed most. The result? Improved speed, accuracy, and confidence in solving circle problems on the SAT.
Key Points and Next Steps
Tackle SAT circle problems effectively by combining Desmos' visual tools with focused practice. The seven strategies in this guide simplify tricky algebraic calculations into clear, interactive graphs, allowing you to spot solutions almost instantly.
Desmos offers a major advantage on test day. By mastering its features, you can quickly verify centers, radii, and intersections, saving precious time. Its graphing capabilities and real-time adjustments also help you catch and correct mistakes before finalizing your answers.
While Desmos excels at visualization, understanding circle concepts is still crucial. Use Desmos to confirm your manual calculations, not as a substitute for core problem-solving skills. This balanced approach ensures you're ready to tackle problems efficiently, whether graphically or algebraically.
Regular practice with Desmos is key. Familiarity with entering equations and tweaking settings builds confidence, making you more prepared on exam day.
The next step? Pair your Desmos skills with ChatSAT. This platform offers structured exercises to sharpen your approach further. Its Urgency Detector highlights where graphing can provide the most benefit, while mixed-topic drills help you decide when to rely on Desmos or solve problems manually.
FAQs
How can I use Desmos to find the center and radius of a circle from its equation?
Finding the Center and Radius of a Circle with Desmos
To determine the center and radius of a circle using Desmos, start by rewriting the equation of the circle into its standard form: (x − h)² + (y − k)² = r². In this format, (h, k) represents the center of the circle, and r is the radius.
If the equation isn’t already in standard form, you’ll need to complete the square to rearrange it properly. Once you have the equation in the correct form, input it into Desmos. The graph will display the circle, making it easy to visually identify the center and radius. Desmos updates the graph instantly as you adjust the equation, so you can confirm your work in real time.
To find the radius, you can either calculate the distance between the center and a point on the circle using the distance formula or simply observe it on the graph. Desmos simplifies this process, making it a handy tool for visualizing and solving circle-related problems - perfect for SAT prep or other math challenges.
How can I use Desmos to easily solve SAT geometry problems involving intersections?
Using Desmos to Solve Intersection Problems on the SAT
When tackling intersection problems on the SAT, Desmos can be a game-changer. Start by graphing both equations in the tool. Desmos will instantly highlight the intersection points for you. Simply click on these points to see their exact coordinates.
To take it a step further, use the slider tools to adjust variables dynamically. This feature helps you visualize how changes affect the graphs and their intersections. Spending some time practicing with Desmos before test day will make you more familiar with its capabilities, allowing you to pinpoint intersections quickly and with confidence during the exam.
How can I use Desmos with ChatSAT to improve my SAT circle problem-solving skills?
Boost Your SAT Circle Problem Skills with Desmos and ChatSAT
Pairing Desmos with ChatSAT can make tackling SAT circle problems much simpler - and even a bit more engaging. Desmos lets you create and adjust circle graphs, giving you a clearer visual representation of the problem. Combine that with ChatSAT's step-by-step guidance, and you can tweak graphs in real time to grasp concepts better and solve problems with greater precision.
This duo works wonders for common SAT circle challenges, like calculating areas, circumferences, or identifying points of intersection. Adding Desmos to your study routine not only helps you sharpen your geometry skills but also makes your prep sessions more efficient and effective.